
In today's fast-paced business environment, waiting for end-of-month reports to make critical decisions is no longer viable. Power BI dashboards provide real-time visibility into your business performance, enabling leaders to make informed decisions quickly and confidently.
The primary advantage of Power BI is its ability to connect to multiple data sources simultaneously. Whether your data lives in Dynamics 365, Excel spreadsheets, SQL databases, or cloud applications, Power BI brings it all together in unified, interactive dashboards. This consolidation eliminates the need to switch between systems or manually compile reports.
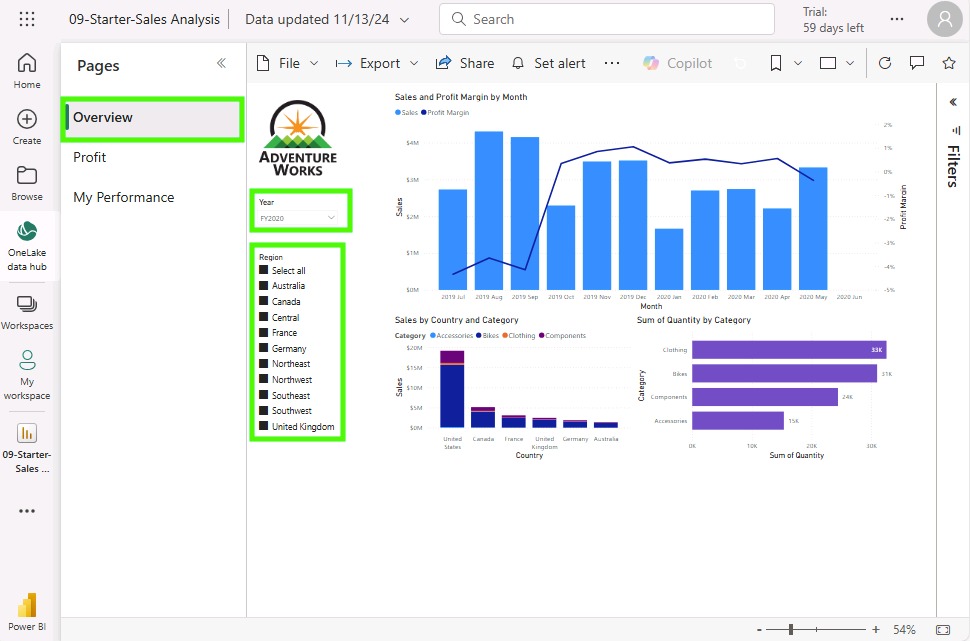
Interactive visualizations make complex data easy to understand at a glance. Sales managers can see pipeline health, revenue trends, and team performance through intuitive charts and graphs. Financial controllers can monitor cash flow, expenses, and budget variance in real-time. Operations teams can track inventory levels, production efficiency, and supply chain metrics.
The drill-down capability of Power BI dashboards allows users to start with high-level overviews and then dig into specific details as needed. Click on a region showing declining sales, and instantly see which products, customers, or sales representatives are contributing to the trend. This investigative power helps identify root causes quickly.
Mobile access ensures decision-makers have critical information available wherever they are. Power BI mobile apps deliver full dashboard functionality on smartphones and tablets, with notifications for important metric changes or threshold breaches.
Sharing insights across your organization becomes effortless with Power BI. Publish dashboards to specific teams, embed them in SharePoint or Teams, or schedule automated report distribution. This democratization of data ensures everyone works from the same facts when making decisions.